February 9, 2017
Dr. Kathryn Sobek, Filipodia Editor
About a month ago, we discussed the importance of figure legends in clearly presenting your data. Like a figure, tables also convey data and should be able to stand on their own. This means after reading your table that your audience will have a general understanding of your methodology and your conclusion. I have created a fake table here, in order to show how the following tips can be used to develop an effective table.
The changes I made after each tip are in red.
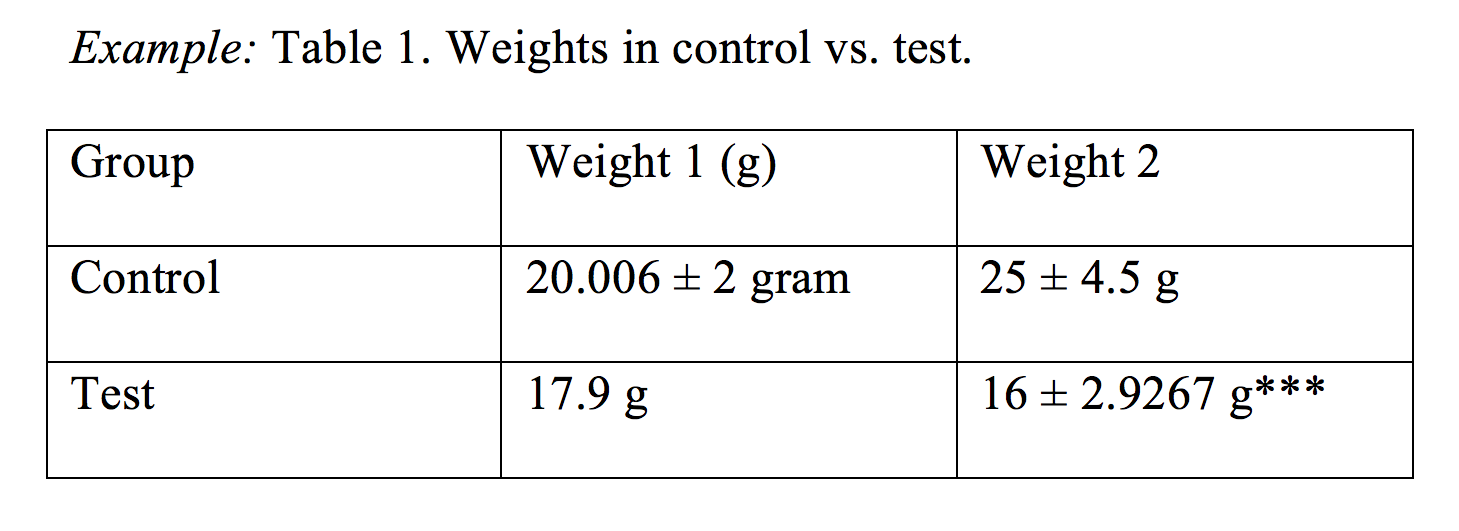
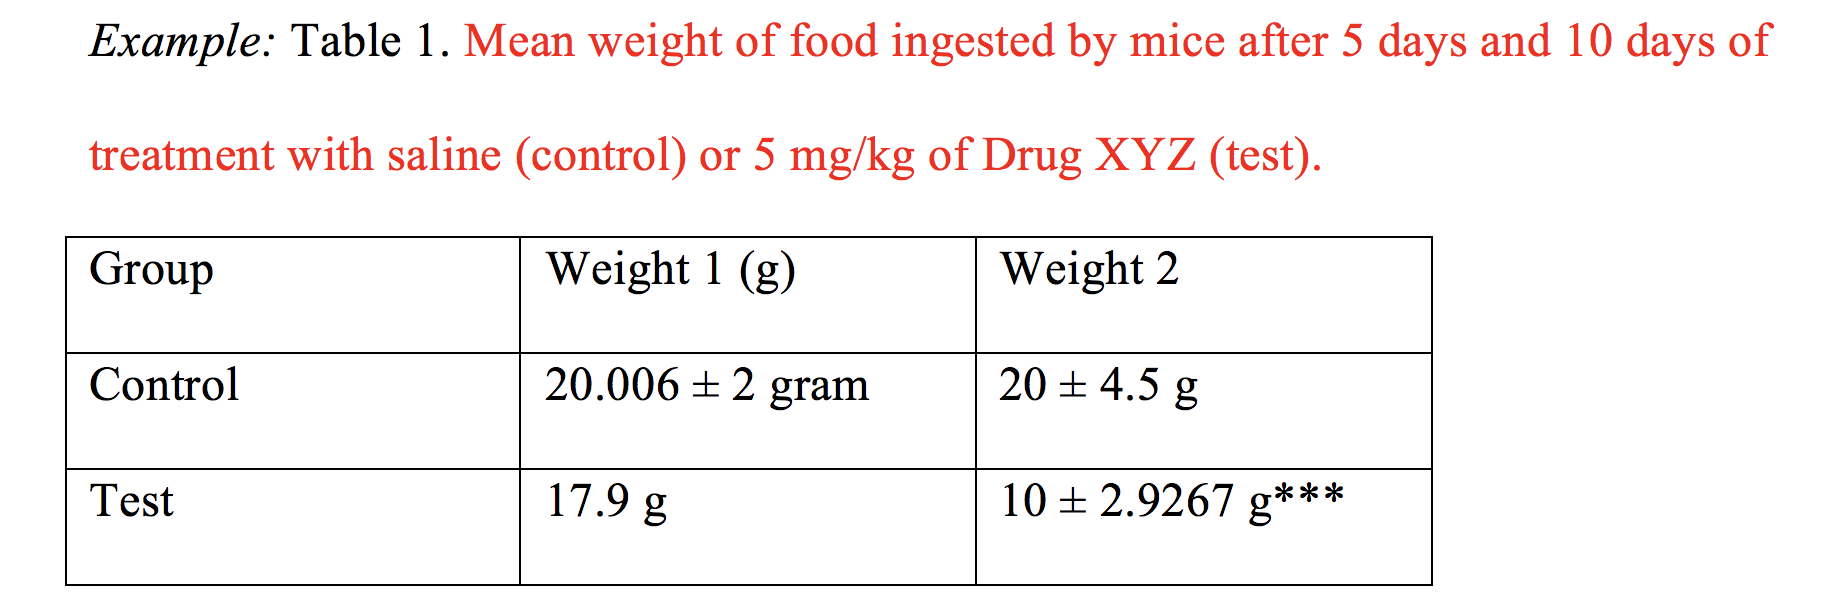
Write a descriptive title. The title should sufficiently describe the data presented. In some cases, the title could be the conclusion drawn from the data. In our example, it is unclear what the control and test groups are or what was weighed without looking at the methods section. The study subject, treatment, sample size, and statistics are items that may be included in the title. For tables describing qualitative data (e.g. patient demographics), it is still important to include a descriptive title (e.g. Demographics of patients receiving Drug XYZ treatment).
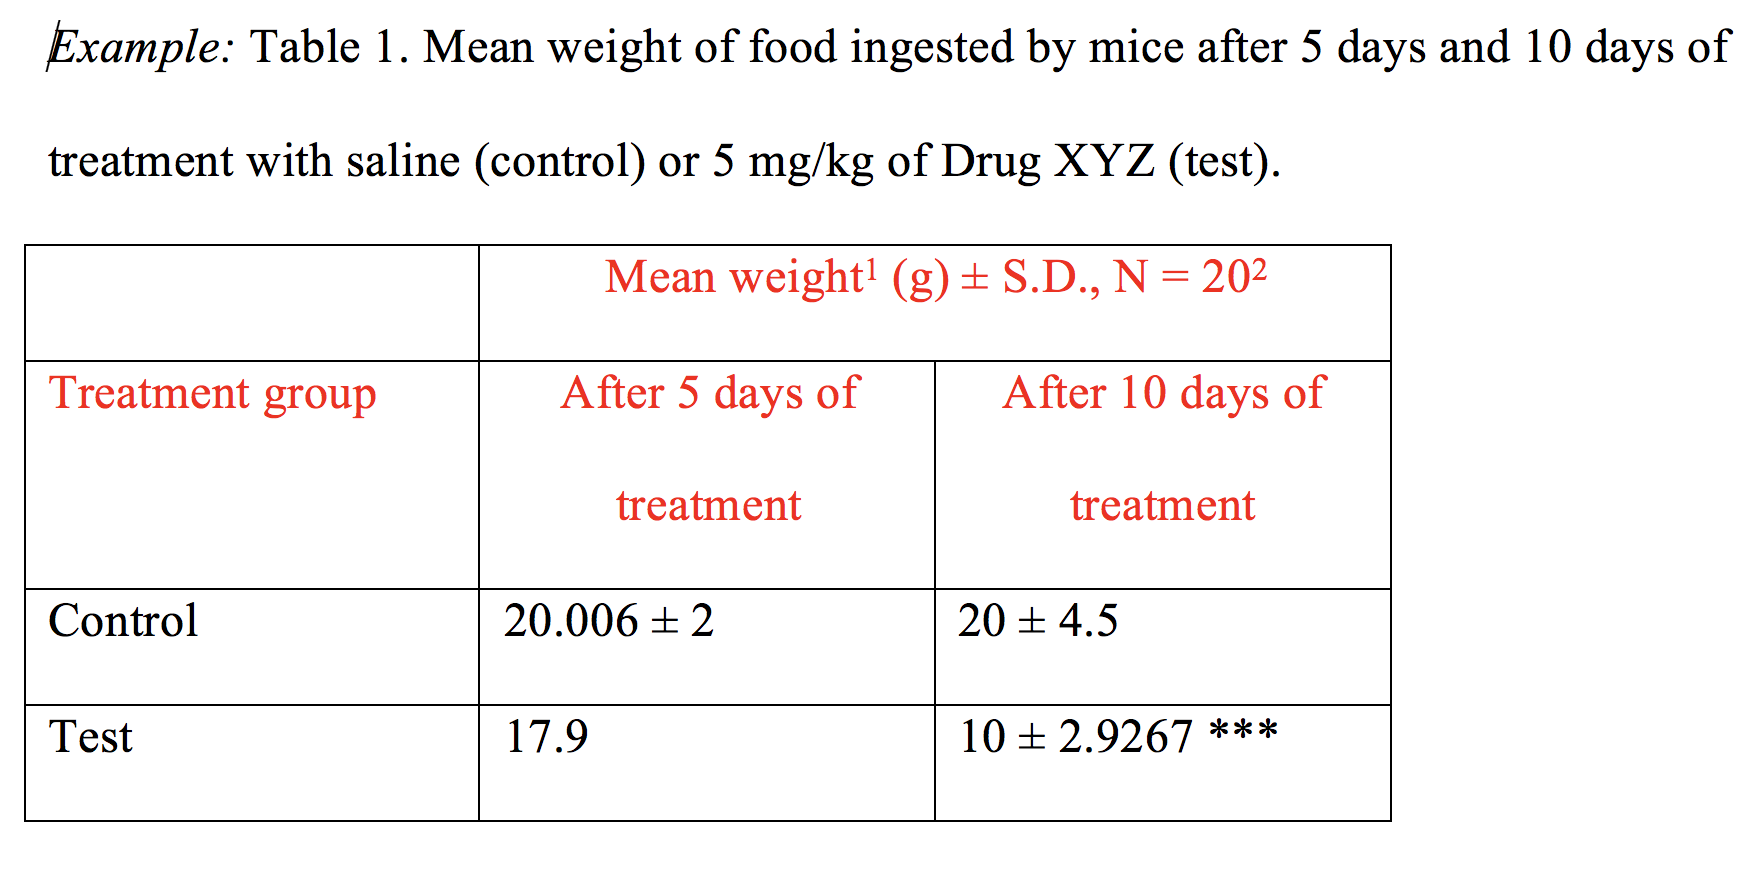
Label each column. Each column must be clearly described. It is particularly important to designate whether the number after the ‘±’ is a standard deviation or a standard error of measurement. This is also where to specify the units used. In this example, one of the column headings states that the measurement is in grams (g), but then gram and g are also written in the table. This is redundant and should only be stated in the column heading. This is also an appropriate place to include the sample size if it was not mentioned in the title.
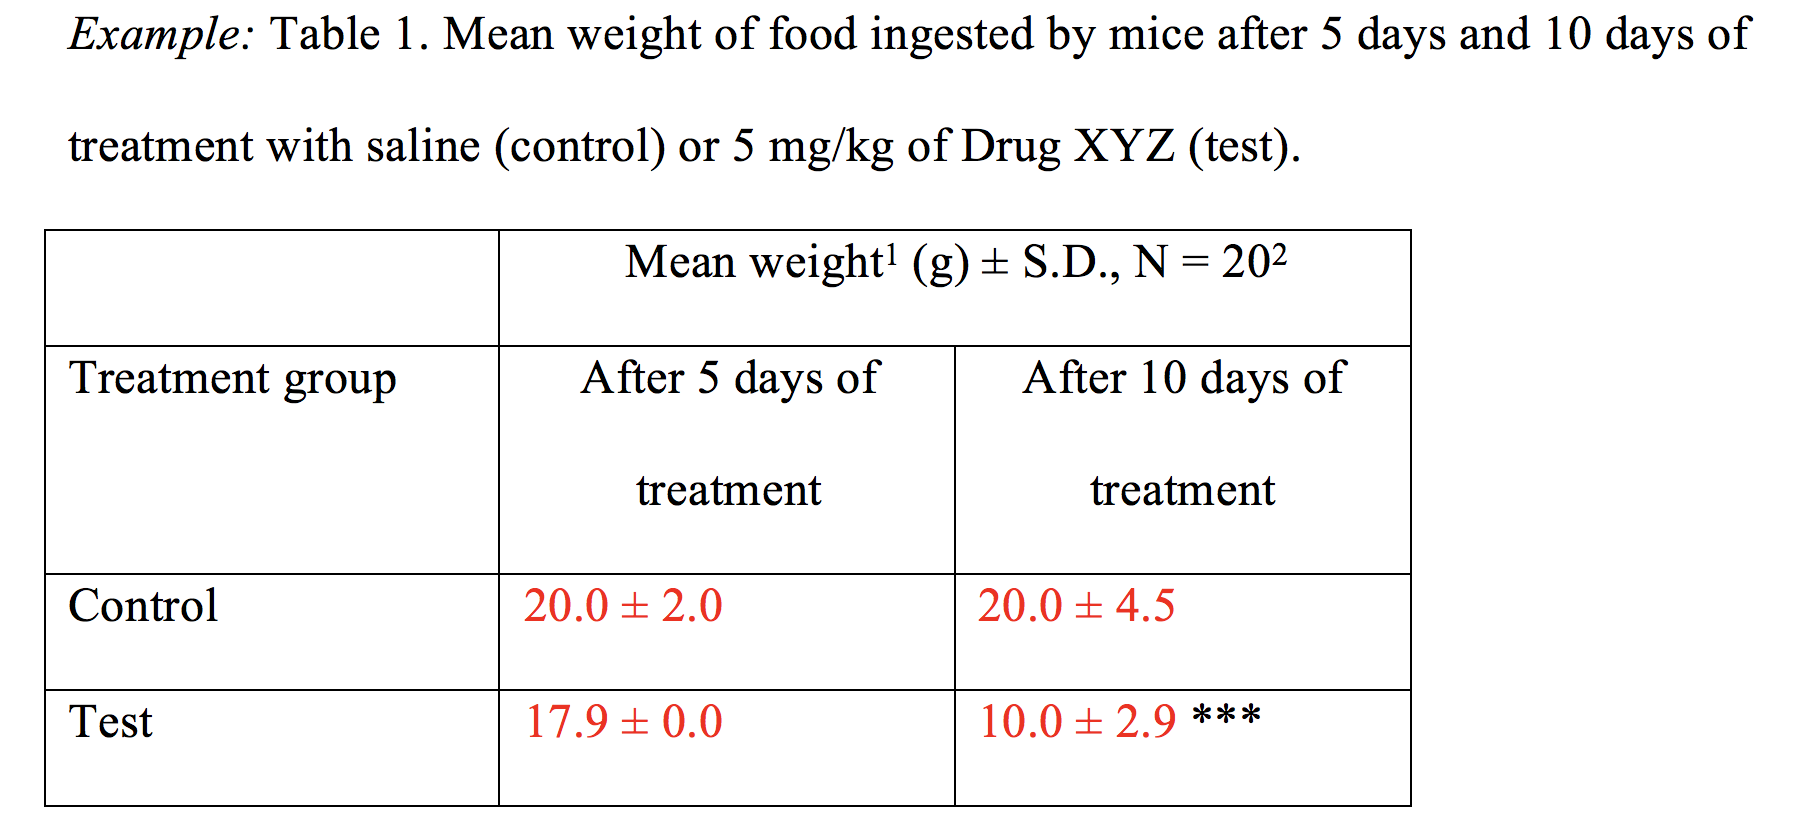
Keep data presentation consistent. The number of places after the decimal used should remain consistent throughout your entire manuscript, including your table. The number that you use is a personal preference, but one or two places after the decimal are common.
Include footnotes, if necessary. Footnotes are typically used to clarify the table. For example, a footnote can be used to show statistics or to describe how the sample was calculated.
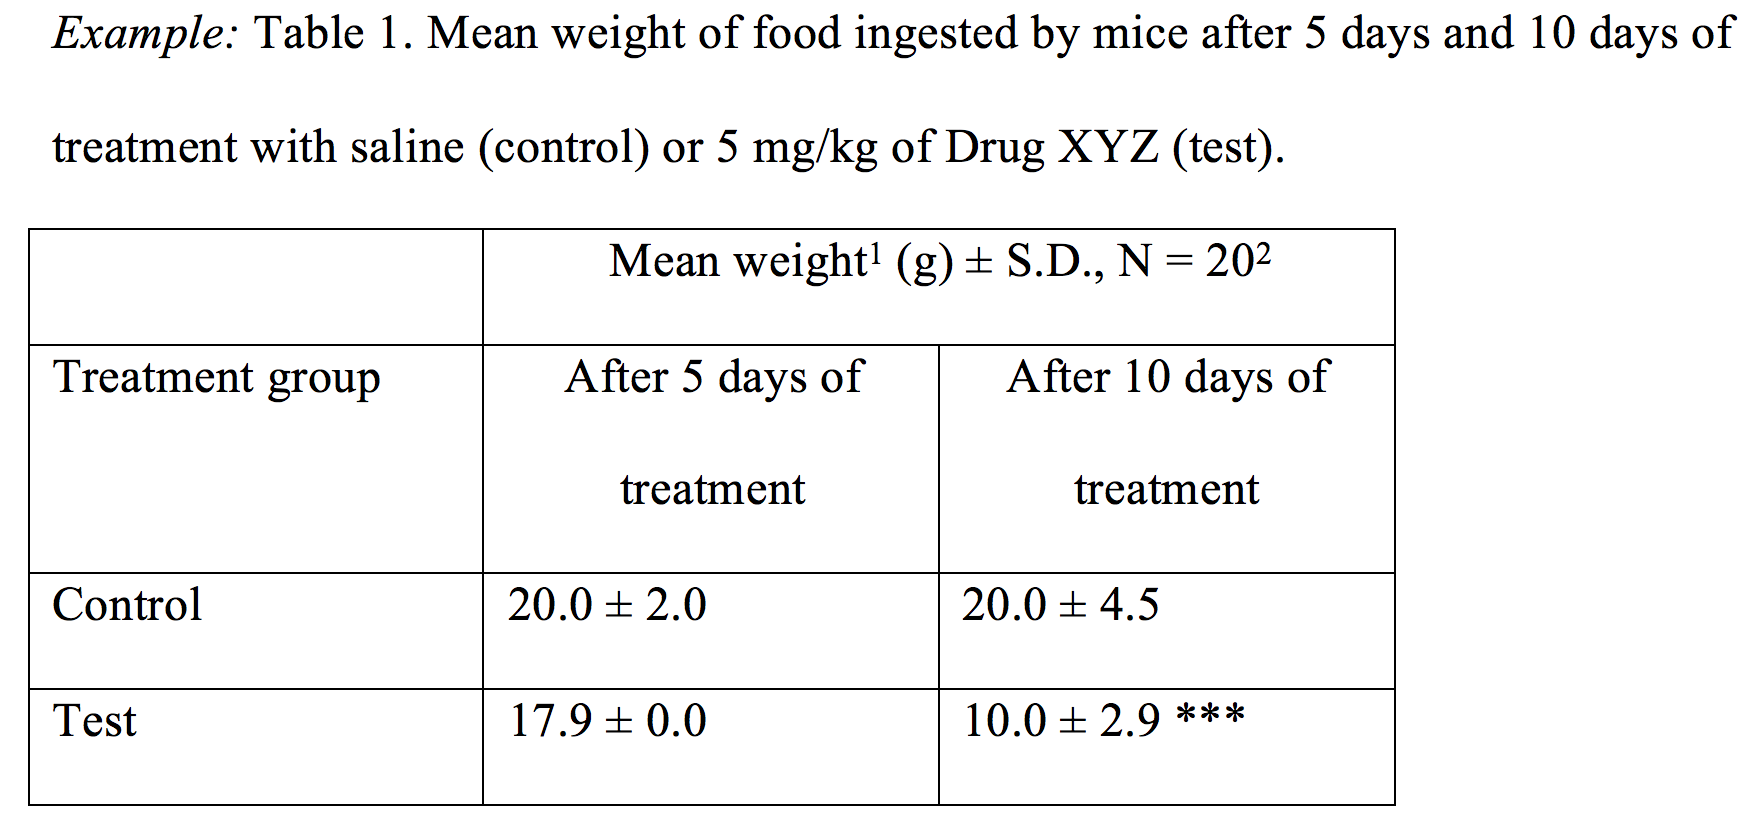
1 The weight of ingested food was calculated by weighing
the food remaining after 5 days or 10 days, then subtracting
that from 40 g of food given at 0 days and 5 days, respectively;
2 The weight of the food from twenty cages housing three
mice each was measured for each treatment group.
***Significant compared to the control after 10 days of treatment
at p < 0.001 (t-test).
My final tip is for referencing your table in the results section. Summarize and draw the main conclusion from the data, but do not list the numbers in the ‘table’. Also when the table is referenced in parentheses, do not abbreviate table. To reference our sample table in our manuscript, I would write: After ten days of treatment with Drug XYZ, the mice consumed 50% less food than the control group (Table 1).